During Science classes, students are supposed to carry out a wide variety of experiments. These practical sessions are meant to assist learners to understand the theoretical explanations. Hence, understanding the Means of Recording Experiment Results is deemed very important for both students and teachers.
It is advisable to take as many values as possible and make a table of the values
– All the readings must be taken to the same number of significant figures or decimal places.
Example 1: in an experiment aimed at determining the resistance of a metal, the following readings were obtained: The voltmeter read 5.2V and the ammeter 2.3A. The resistance was calculated as follows:
R=(5.2)/(2.3)=2.252
This answer has the wrong number of significant figures. The correct value should be 2.3(i.e. to two significant figures) since the number of significant figures of the least precise value (2.3 or 5.2) is two
– The number of significant figures in all calculations made from recorded results must be the same as in the results (example above)
Example 2:
|
X(m) |
I(A) |
Y = I(A) |
|
0.000 0.300 0.500 0.700 0.800 0.900 |
0.9 0.48 0.36 0.28 0.26 0.24 |
1.11 2.08 2.78 3.57 3.85 4.17 |
Table 1.1: Data presentation in a table
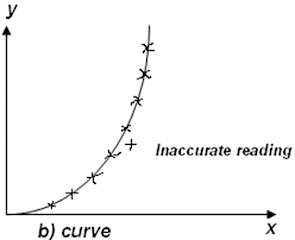
The results recorded can be used to draw graph. The graphs could be curves or straight lines.
– The points should be correctly plotted on the graph paper
– If the scale is not provided, then an appropriate scale must be chosen
– Graph could be interpreted in different ways.
– If the graph is a straight line, then we can find the gradient.
THE SCALE
Check the size of the graph paper and try to choose simple scales that will give a graph which will cover more than half page. For example: choose one large square on the graph paper to represent 10g or 20g.
– Avoid choosing numbers such as 3g, 7g, or 9g as it becomes very difficult to plot fraction for these values
– Avoid choosing a scale that represents an even number of units by an odd number of squares. For example: don’t try to represent 10g by 3 squares on the graph paper
– Determine what each small division on the scale chosen would stand for.
– When the scale has been chosen, make sure that you show it clearly on the graph and indicate the unit of measure
– Label the two axes of the graph with correct symbols and units. The independent variable is on the horizontal x-axis(abscissa) and the dependent variable is on the vertical y-axis(ordinate)
PLOTTING THE POINTS
– Mark the position of the points with a cross or dot neatly using a sharp pencil
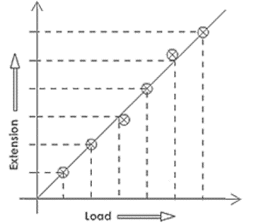
– The plotted points must be joined with a single straight line or a continuous curve. The graph should cover as much of the area of the graph paper as possible. This requires a sensible choice of scale for each axis. It is unlikely that points plotted from real experimental results will all lie on a straight line or smooth curve due to errors. Hence try to produce a straight line or smooth curve which passes through as many of the plotted points as possible or which leaves an equal distribution of points on either side. Refer the graph shown in figure (a) above which shows a best fitting line.
Every graph should have the following:
- a title (e.g., Load against extension)
- both axes labelled with units
- scales being used on each axis
- Points plotted with crosses or with dot and circle.
Deductions from graphs
The straight line graph
If you are required to determine the gradient of a straight line graph, there are two methods that can be used:
a. Choose two labelled points on the graph and the interval between the two points should cover more than half the line.
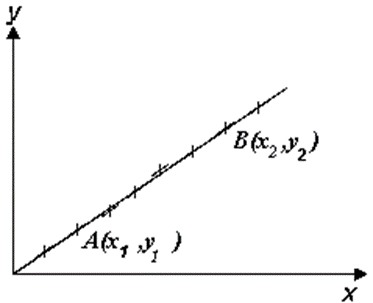 |
| Gradient of a straight line Method (a) |
b.
|
|
The second method involves the use of a right-angled triangle; once again the points selected on the line must cover at least half its length. The lengths of two other sides of the triangle are determined using the scales on the graph. These values are recorded and the gradient of the line can be calculated using the formula: Gradient=(y_2-y_1)/(x_2-x_1 )=Y/X
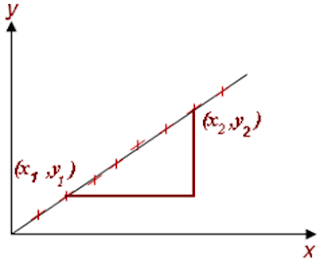 |
| Gradient of a straight line Method (b) |
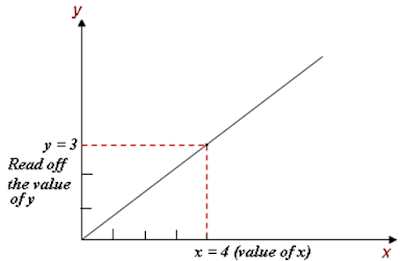
If you want to find a corresponding point given one point on either axes, then read off the point by drawing perpendicular lines to both axes from the given point. Using the graph to predict the reading of measurements that lie between those actually made is known as ‘interpolation’.
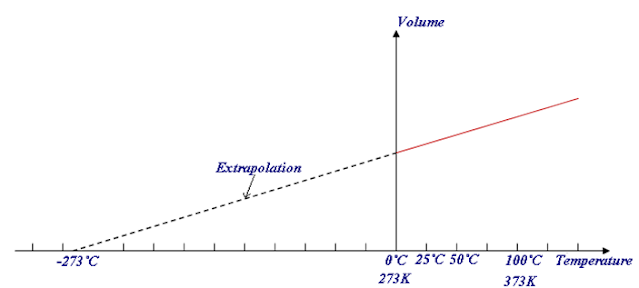
You may be asked to get information from a graph which may not lie within the range of the collected data. Often it is necessary to extend the graph (following the obvious trend) to include the range of the data required. This is called “extrapolation” and it is illustrated below.
This method is used when obtaining zero on Kelvin scale
1.3.3. THE LABORATORY RECORD OF AN EXPERIMENT:
Your laboratory record of an experiment may be split into the follow sections:
1. Headings: Start each experiment on a new page and write the name of the experiment, its number and the date.
2. Aim:as given at the start of each experiment.
3. Apparatus: write the name of the apparatus used.
4. Theory:you must give only brief and relevant notes
5. Procedure:give a brief description of how the data is obtained, and the order in which it was done
6. Measurements/Data:enter the measurements in a ruled table as far as possible, listing them below each other in a column. Give the units in which each is measured. List all the measurements taken; do not subtract two measurements and only record the difference.
7. Data analysis: convert measured values to SI units and substitute them in the formula.
8. Graph: if a graph is to be plotted, follow the guidelines given in 1.4.1 and 1.4.2 above.
9. Result/Conclusion:this should summarise all that you discovered in the course of the experiment. The final result should be given in a sensible order of accuracy and should state the units concerned. For example, “the resistivity of the metal all measured to be ”.
10. Discussion:you can suggest here how any improvement can be made to the procedure you followed. Or describe any difficulty you encountered.
N.B. use a capital letter and do not underline or simply use lower cases and underline. E.g. AIM or Aim.

